
Multiscale footprints reveal the organization of cis-regulatory elements
ATAC-seq has long been the workhorse for profiling chromatin accessibility, providing a genome-wide map of cis‑regulatory elements (CREs). But identifying an accessible switch is not the same as knowing which protein is flipping it.
A cCRE may be open, but which transcription factors (TFs) are actually bound? Are nucleosomes stably phased or displaced? Conventional approaches each hit a wall. ChIP‑seq delivers precise, single‑TF resolution, yet scaling it across all factors and cell types remains impractical. DNase‑seq and ATAC‑seq footprinting are conceptually attractive, but in practice they are plagued by the intrinsic sequence bias of the Tn5 transposase---which preferentially cleaves GC‑rich regions---yielding high false‑positive rates. Moreover, classical footprinting is largely confined to the TF scale (~20 bp) and cannot resolve nucleosome-sized footprints (~147 bp), let alone the sparsity that makes single‑cell ATAC‑seq data notoriously difficult to footprint.


In January 2025, the Buenrostro laboratory---the group that originally developed ATAC‑seq---published a major methodological advance in Nature: Multiscale footprints reveal the organization of cis‑regulatory elements. The work introduces PRINT (Protein--regulatory element interactions at nucleotide resolution using transposition) and a deep‑learning framework, seq2PRINT, which together may represent the most substantial upgrade to ATAC‑seq data analysis since the assay itself was introduced.
Correcting the Tn5 "scissors" first
A subtle but critical detail underpins the entire approach.
Tn5 transposition is not truly random; the enzyme exhibits a pronounced sequence preference. Even on deproteinized "naked" DNA, cleavage is uneven, with marked enrichment in GC‑rich contexts. Relying on such biased data without correction is akin to measuring with a distorted ruler---every downstream estimate carries a systematic error.
To address this, the authors performed extensive Tn5 insertion profiling on BAC (bacterial artificial chromosome) naked DNA and used these data to train a convolutional neural network (CNN) that predicts Tn5 cleavage propensity from sequence alone. This model substantially outperformed k‑mer, PWM, and even ChromBPNet (R = 0.94 vs. ~0.8), and reduced false‑positive footprint calls by an order of magnitude. Critically, none of the subsequent multi‑scale or deep‑learning analyses would have been reliable without this initial bias correction.
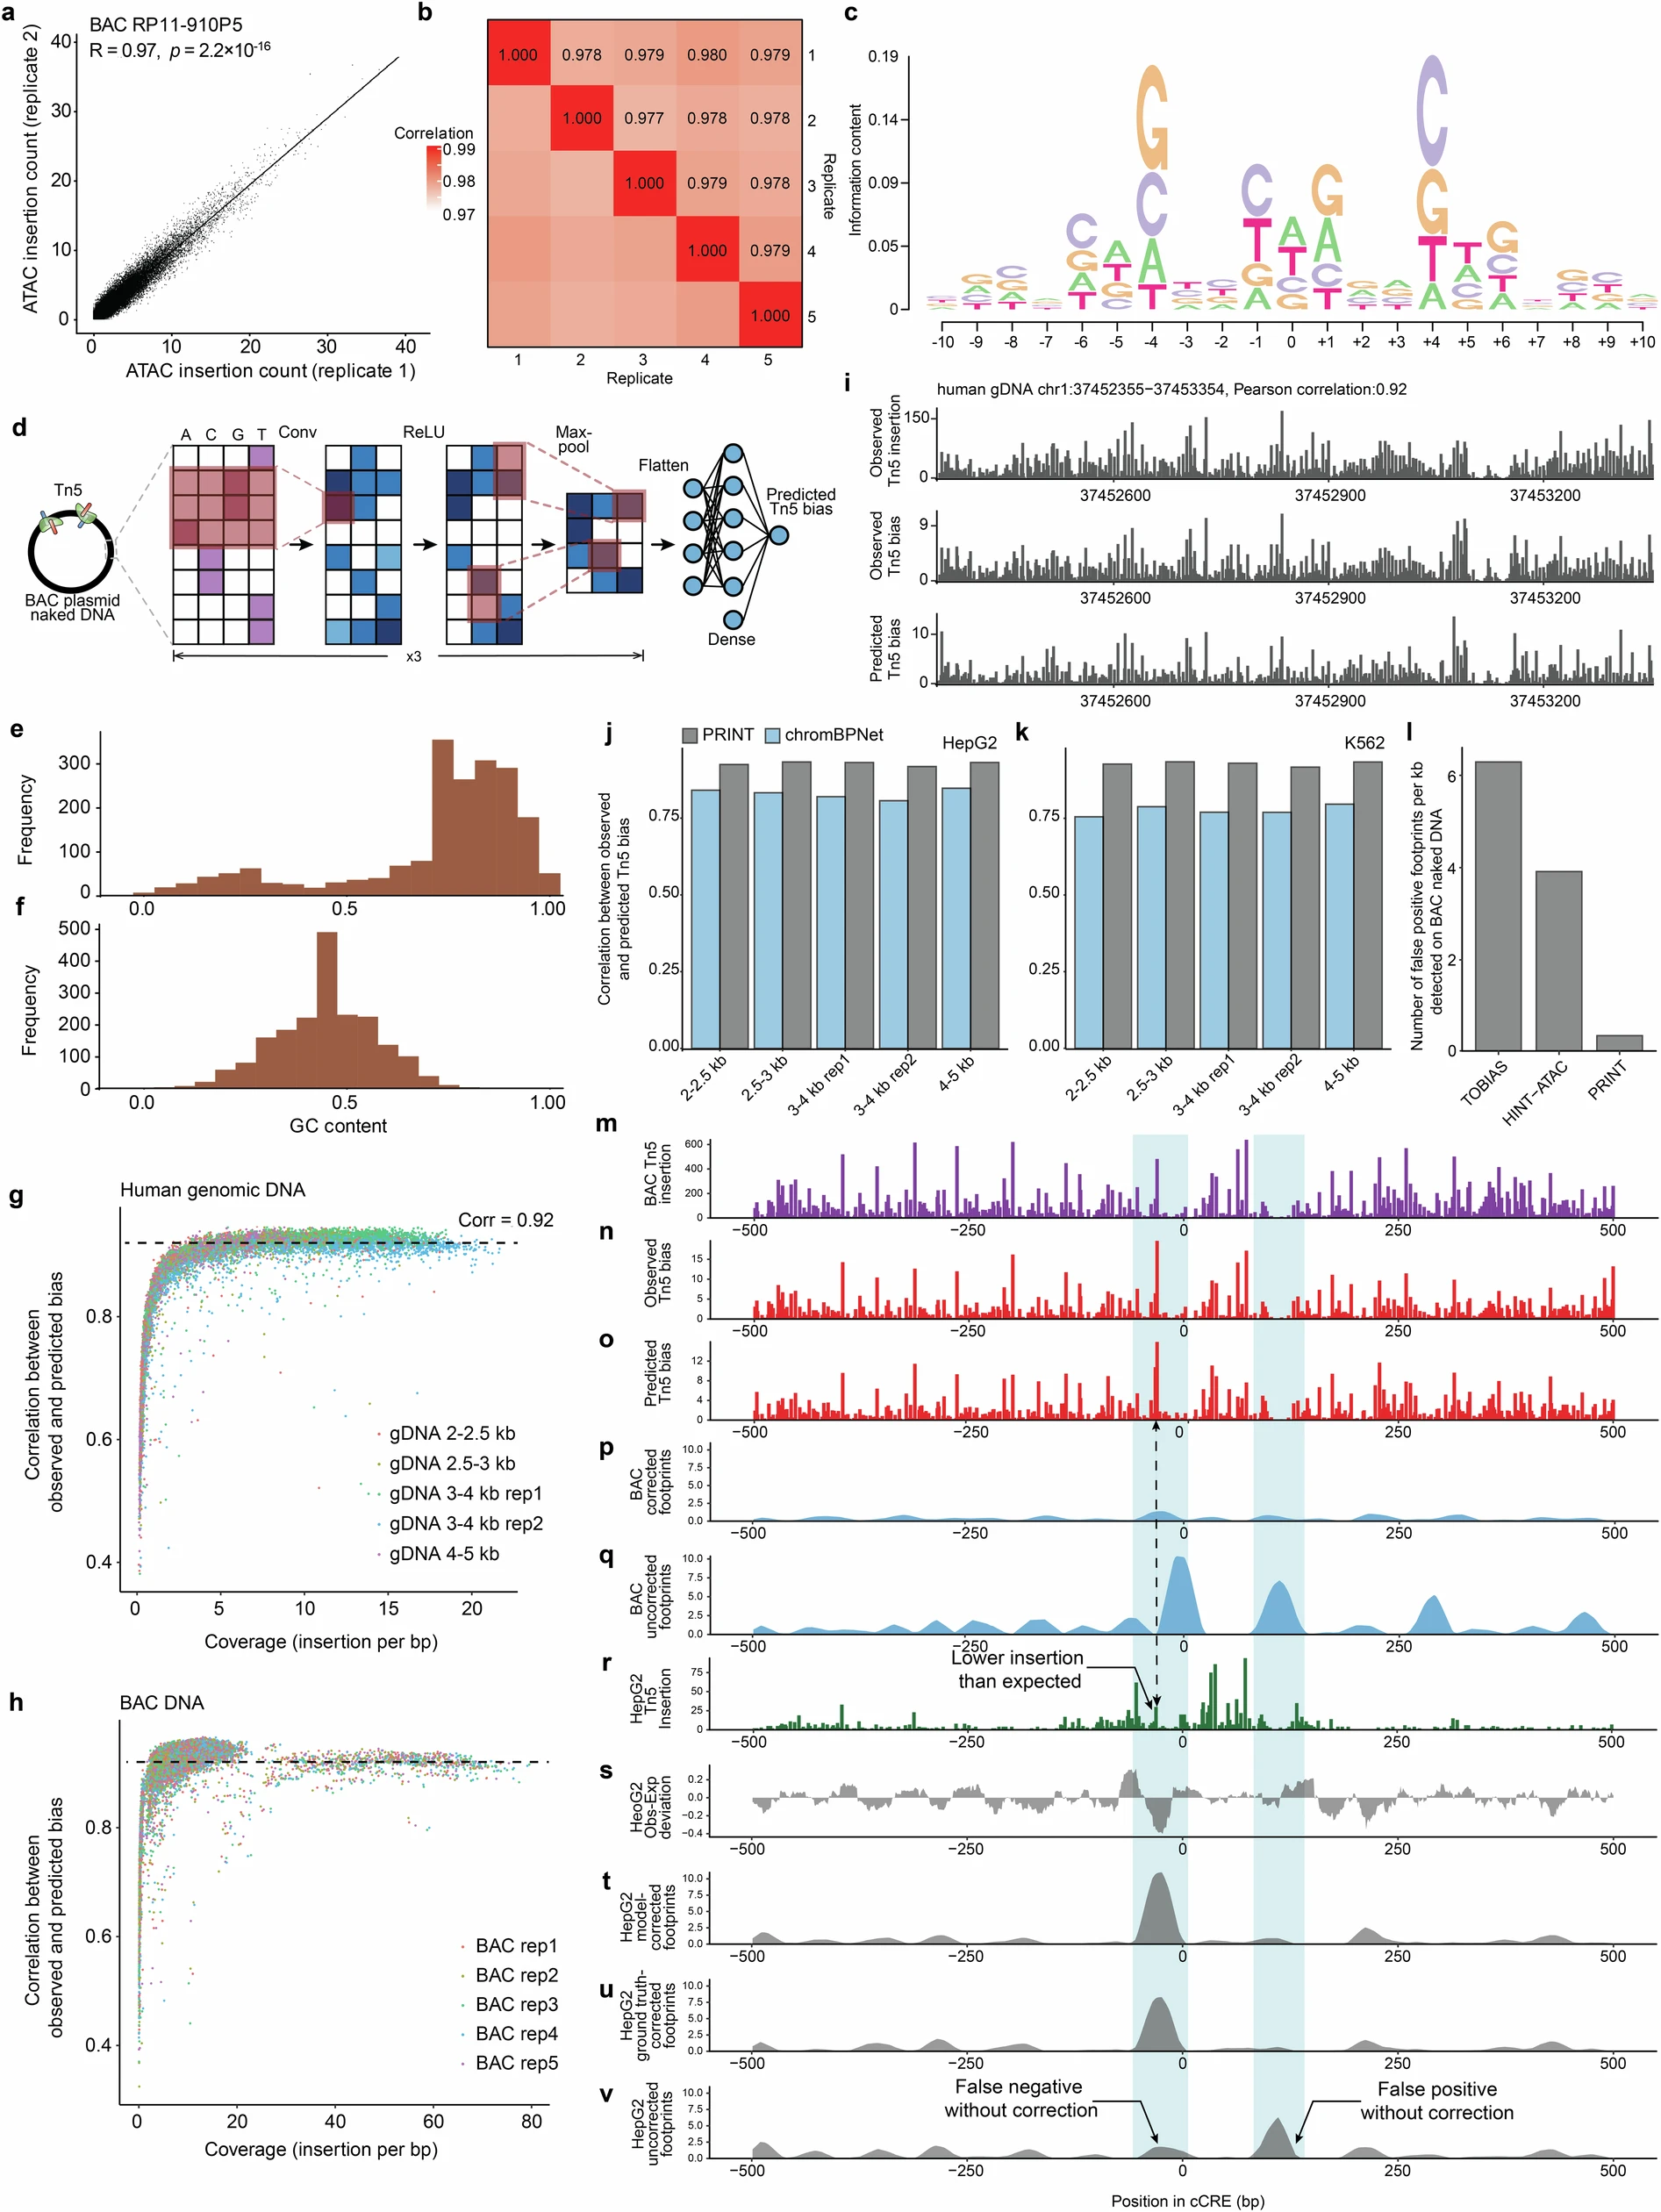
Tn5 bias modelling and footprinting

Expanding the footprint scale from 20 bp to 200 bp
Standard footprinting assumes that protein‑protected depletion occurs predominantly at TF dimensions (~20 bp). Yet a nucleosome occupies 147 bp, and together with linker DNA, the full periodic unit spans roughly 160--200 bp.

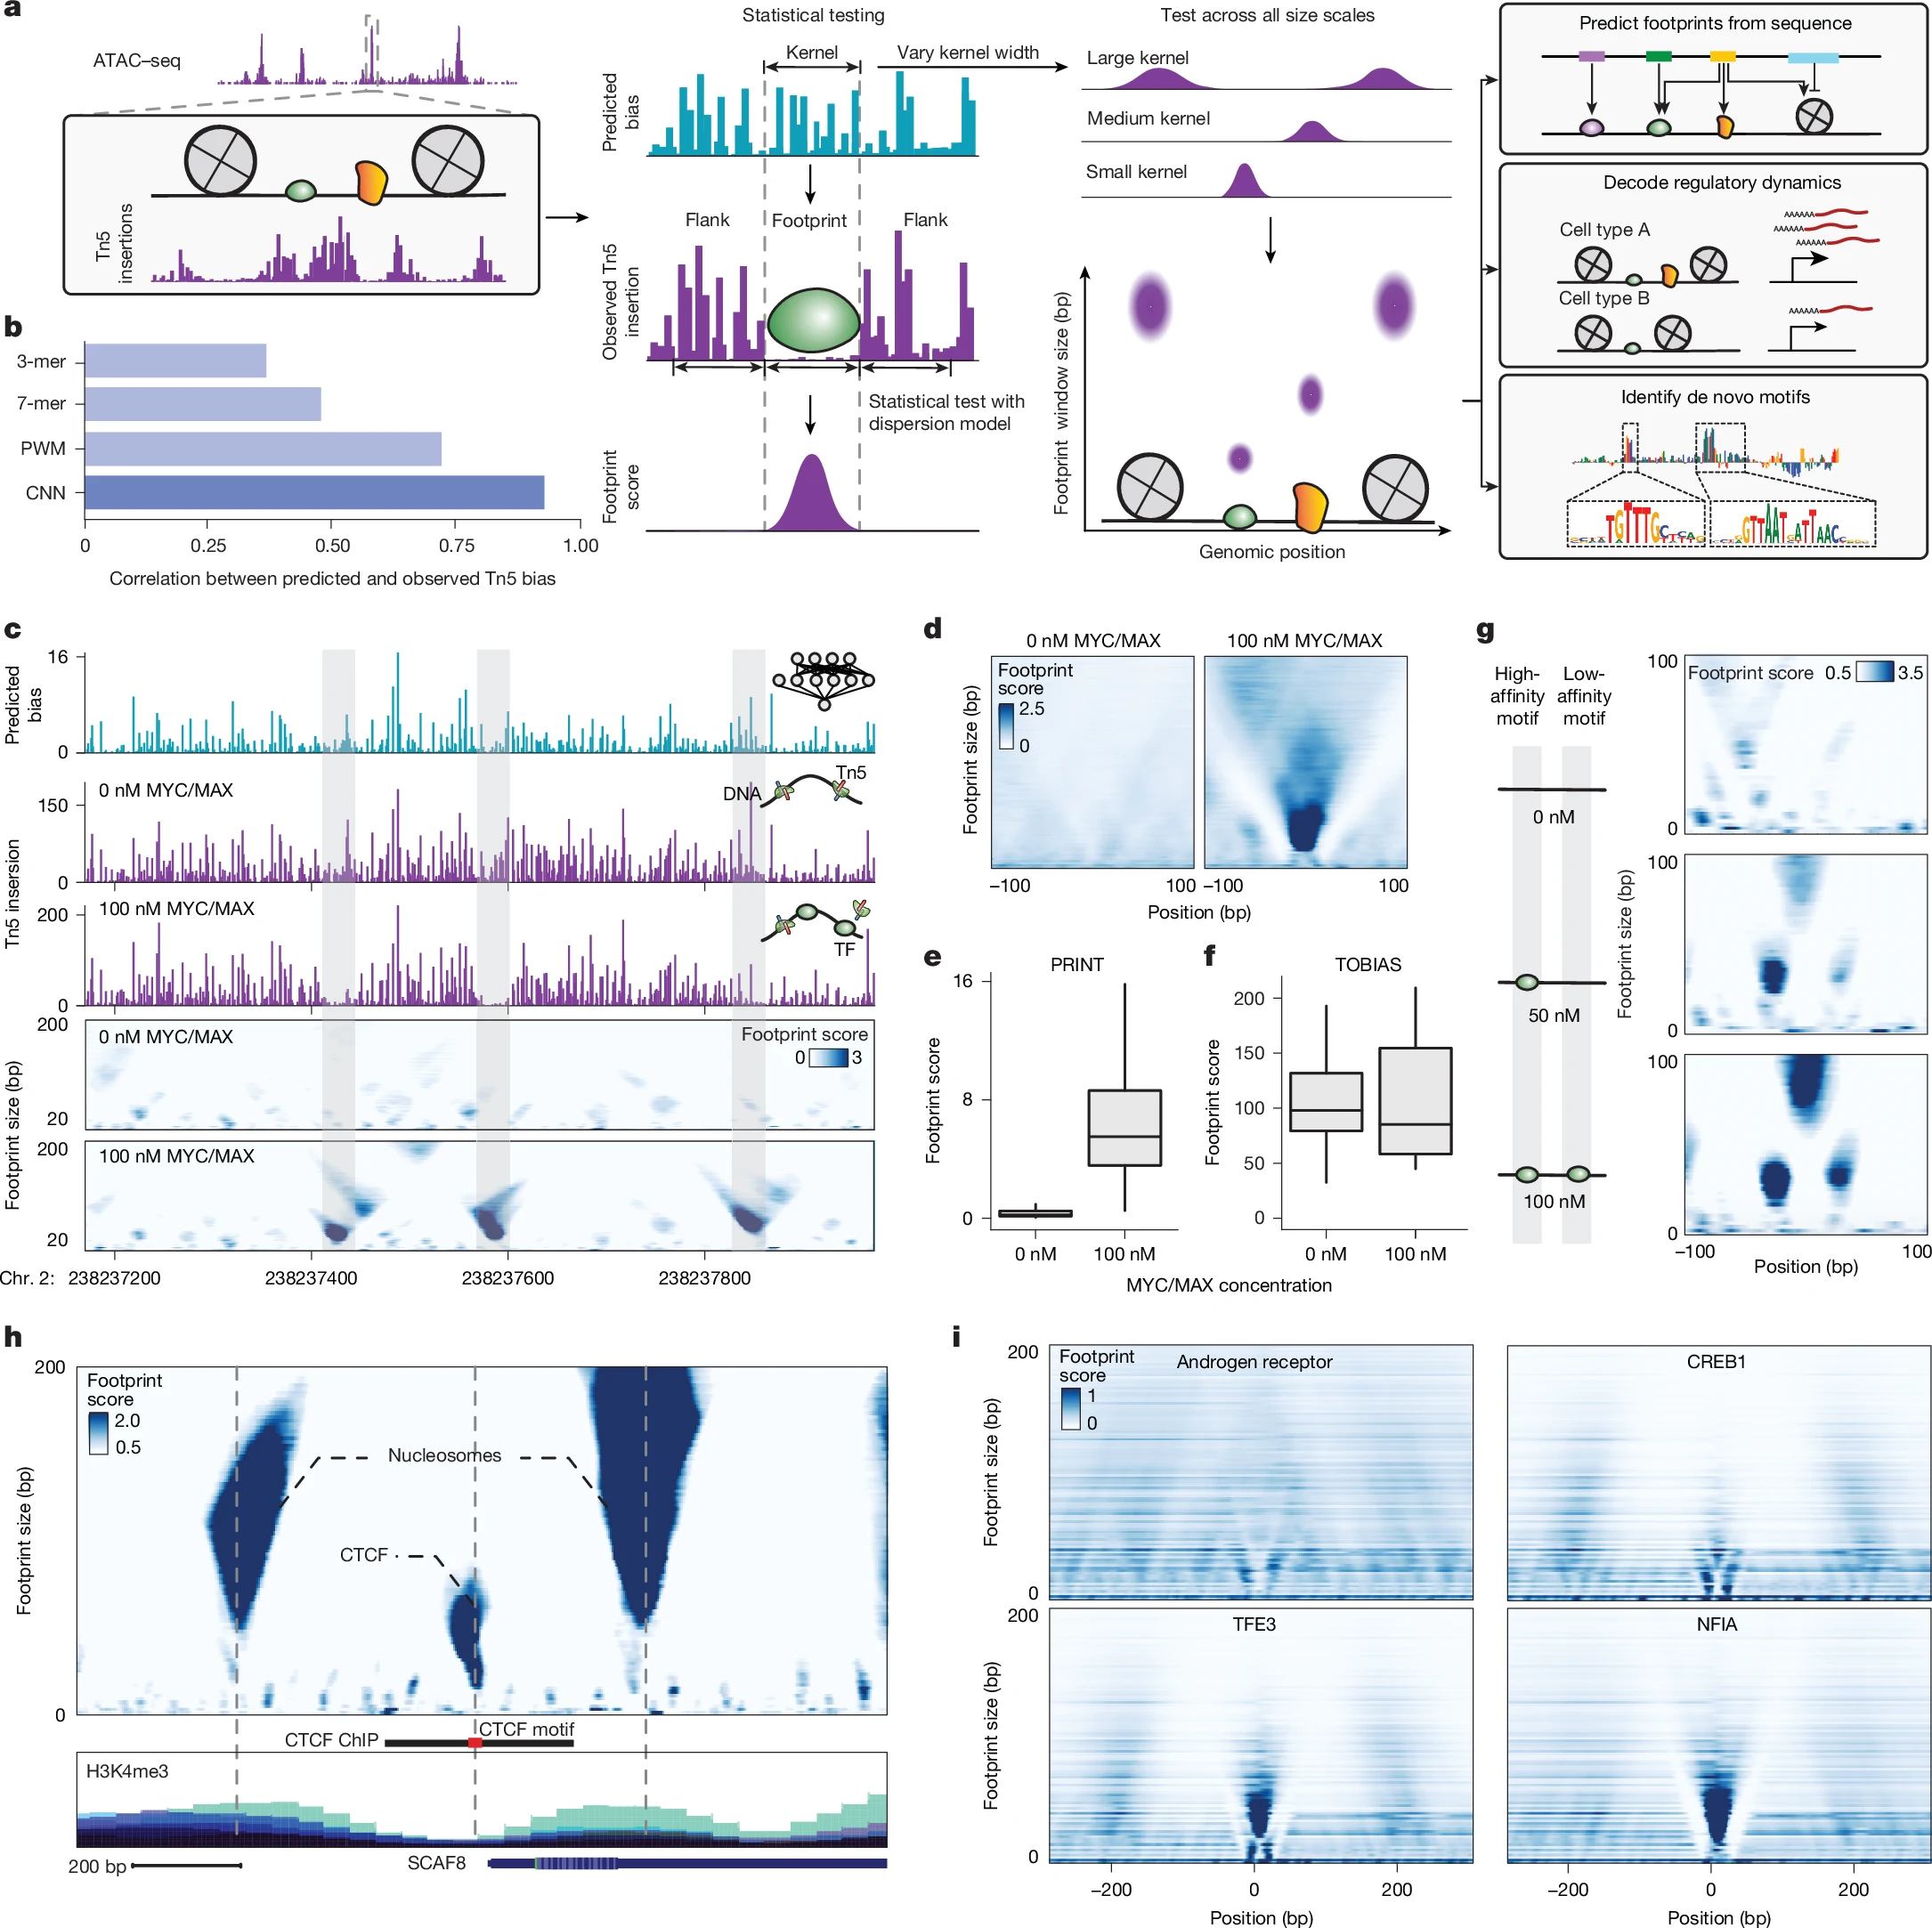
Multiscale footprinting detects DNA–protein interactions across spatial scales
PRINT takes a deliberately straightforward approach: it scans window sizes from 4 bp to 200 bp incrementally and computes a footprint score at each scale. Small‑scale signals capture TF binding, whereas large‑scale periodic patterns report nucleosome phasing.
Rigorous in vitro validation on BAC DNA incubated with purified MYC/MAX or CEBPA demonstrated that PRINT detects concentration‑dependent (50 nM vs. 100 nM) footprint deepening at motif sites. In contrast, TOBIAS---a widely used footprinting method---failed to distinguish foreground from background on the identical dataset. Orthogonal comparison with ChIP‑exo confirmed that PRINT footprints were highly concordant with exonuclease‑defined binding sites, and even captured events that ChIP‑exo may have missed.
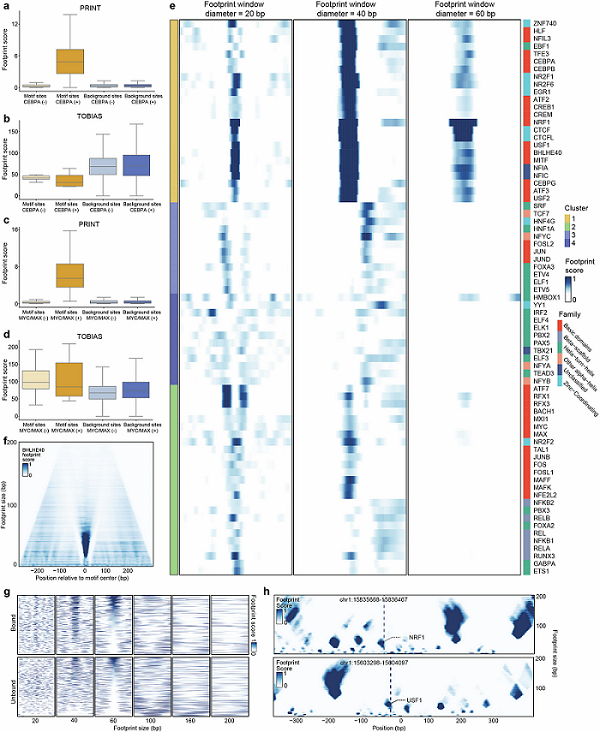
Multiscale footprinting detects binding of diverse TFs

seq2PRINT reading footprints directly from sequence
Having established a reliable multi‑scale footprinting pipeline, the team then asked a more ambitious question: can a model predict multi‑scale footprints ab initio from DNA sequence alone?

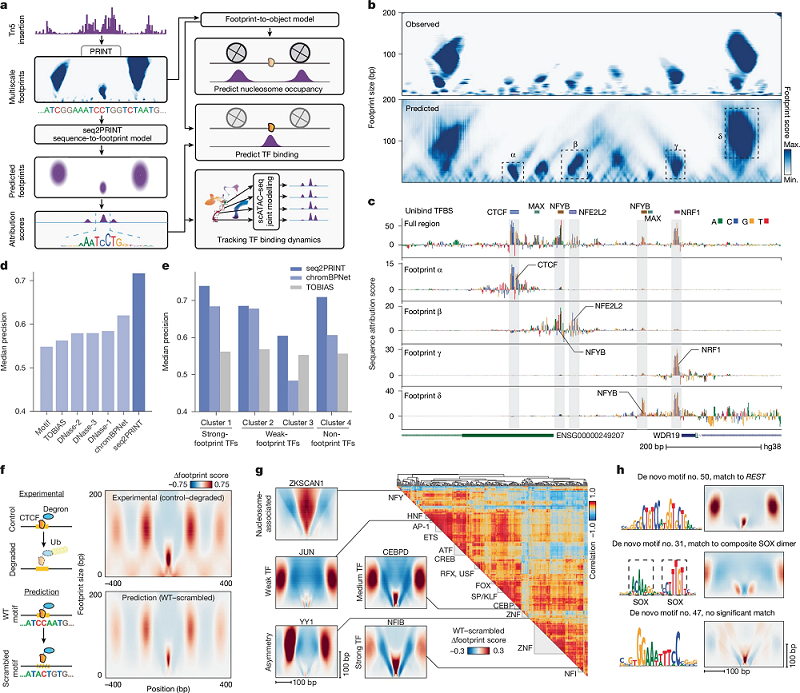
Decoding the genomic syntax of cCRE organization
The result is seq2PRINT. The input is a one‑hot‑encoded ~2‑kb sequence, and the output comprises base‑pair‑resolved footprint intensities across all scales (4--200 bp), together with the region's overall accessibility. The architecture employs grouped dilated convolutions to expand the receptive field to ±920 bp. On HepG2 data, observed versus predicted footprints correlated at 0.75 overall, and performance remained robust to read‑depth down‑sampling.
Yet predictive accuracy is not the most remarkable feature. Using DeepLIFT to compute sequence attribution scores, seq2PRINT can pinpoint exactly which bases contribute to a footprint at a given scale. In one illustrative cCRE, attribution revealed four distinct footprints---α, β, γ, and δ. Footprints α and γ aligned directly with their cognate TF motifs. Footprint β contained both an underlying NFE2L2 motif and a neighbouring NFYB motif, suggesting cooperative binding. Footprint δ corresponded to a nucleosome, yet its position was predicted primarily by flanking NRF1 and NFYB motifs---indicating that a TF (here, NFYB) can be detected indirectly via its effects on nearby nucleosomes, a mode of inference entirely inaccessible to conventional footprinting.

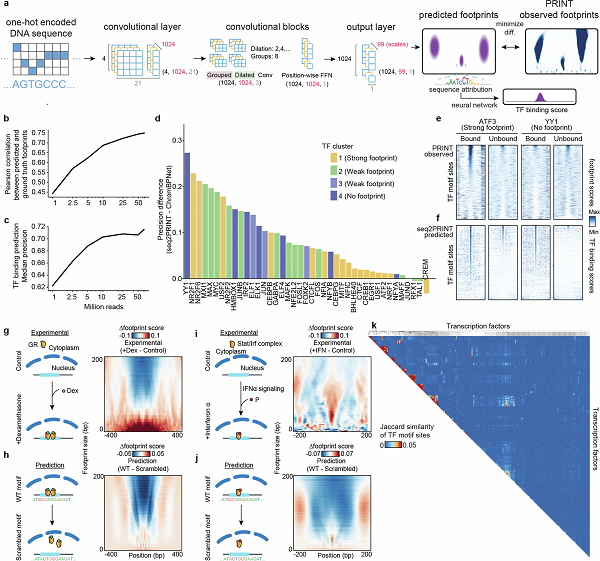
The seq2PRINT framework
Benchmarked against TF binding data, seq2PRINT significantly outperformed ChromBPNet and TOBIAS, particularly for TFs traditionally considered weak‑ or non‑footprinting (e.g., ATF3, YY1).
To test whether the model captured genuine regulatory logic, the authors performed in silico motif ablation---disrupting a TF motif and evaluating the predicted changes in multi‑scale footprints. These predictions correlated strongly with empirical perturbations, including CTCF degron‑induced loss, dexamethasone‑driven GR relocalization, and IFN‑induced Stat2 binding (aggregate R = 0.93). Applying TF‑MoDISco to the learned attribution scores further uncovered 106 de novo motifs, comprising known motifs rediscovered in an unbiased manner, novel composite configurations (such as SOX dimers), and motifs with no match in existing databases like cisBP.
An engineering pivot: LoRA
Training a separate seq2PRINT model for each cell state would be computationally prohibitive for single‑cell data, which routinely span hundreds or thousands of clusters.
To circumvent this, the authors borrowed a technique from natural language processing: Low‑Rank Adaptation (LoRA). They first trained a base seq2PRINT model on bulk‑aggregated data, and then fine‑tuned only low‑rank parameter increments for each pseudo‑bulk, guided by cell embeddings in the cisTopic space. This yielded an ~80‑fold acceleration in computation, with prediction accuracy marginally improved over independently trained models---likely due to the regularization imposed by the shared base model.
Biological insights: a "progressive widening" model of CRE establishment
Applying this toolkit to human haematopoiesis, the team profiled 874,480 bone marrow mononuclear cells (BMMCs) using SHARE‑seq, aggregating them into 1,000 pseudo‑bulks and fine‑tuning LoRA‑adapted seq2PRINT models for each.

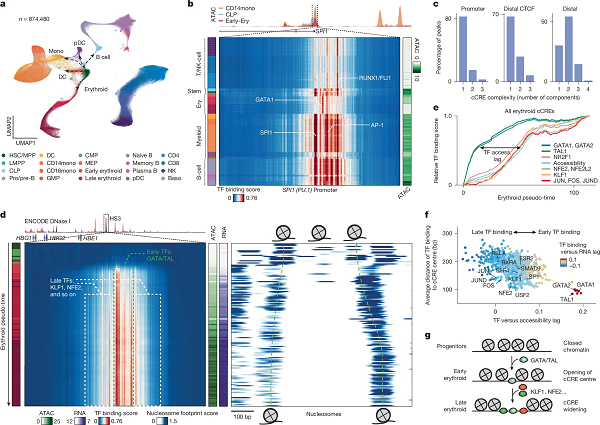
Emerging intra-cCRE dynamics in human haematopoiesis
At the SPI1 (PU.1) promoter, seq2PRINT revealed strong SPI1 and AP‑1 binding in myeloid cells, but in erythroid cells the binding landscape switched almost entirely to GATA1---remarkably, without a commensurate change in overall ATAC accessibility. Thus, "peak height" alone completely obscures the underlying regulatory logic. Genome‑wide, 69.8% of distal cCREs showed multi‑component TF binding patterns (requiring multiple principal components to explain 98% of variance), compared with only 17.2% of promoters, underscoring the far greater cell‑type specificity of enhancer utilization.
A particularly elegant illustration came from the HS3 enhancer at the haemoglobin locus control region. Tracing erythroid differentiation, the authors found that enhancer establishment was not all‑or‑none, but rather expanded progressively from the centre outward. In HSCs and CMPs, nucleosomes were unphased and TF binding weak. As cells committed to the erythroid fate, GATA/TAL factors first occupied the enhancer centre, while nucleosomes began to phase on the flanks. At mid‑to‑late stages, the accessible region widened as flanking nucleosomes were repositioned, allowing KLF1 and NFE2 to bind peripheral sites. HBB expression correlated tightly with this gradual maturation. Genome‑wide analysis of erythroid‑ and lymphoid‑associated cCREs confirmed the general model: early‑binding TFs reside closer to the cCRE centre, whereas late‑binding TFs occupy the edges---implying that CRE establishment is an analogue, continuous process rather than a digital binary switch.
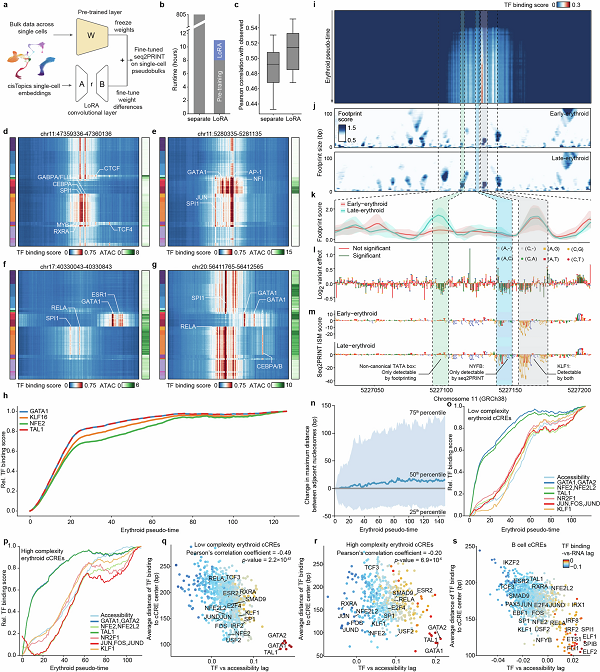
TF and nucleosome dynamics across human hematopoiesis

Ageing widespread nucleosome dephasing
Finally, the authors turned to haematopoietic stem cell (HSC) ageing, profiling young (11 weeks, n=10) and aged (24 months, n=5) male C57BL/6 mice using 10x Multiome (48,225 cells, including 14,640 HSCs).

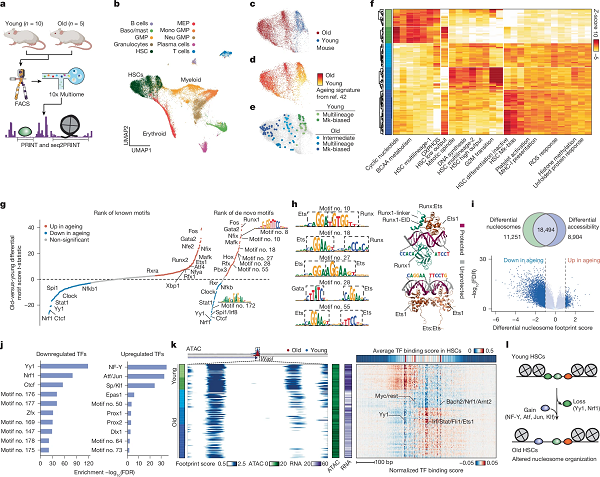
Intra-cCRE dynamics in haematopoietic ageing
At the TF level, aged HSCs showed increased activity of Ets, Runx, and AP‑1 families, alongside a decline in CG‑rich de novo motifs. Most notably, seq2PRINT attribution scores unbiasedly identified abundant Ets homo/heterodimers and Ets/Runx composite motifs that were significantly upregulated with age. To validate these composite motifs structurally, the authors fed the motif sequences and ETS1/RUNX1 DNA‑binding domains into AlphaFold3. The predicted ETS1--RUNX1--DNA ternary structures closely matched the experimentally solved PDB‑4LOZ crystal structure (RMSD = 0.825 Å), with solvent‑inaccessible bases precisely corresponding to the core motifs---a striking physical validation of a computationally predicted cooperative binding mode.
The nucleosome changes, however, were arguably the most striking. Aged HSCs exhibited a global, pervasive loss of nucleosome footprints at cCREs. Crucially, 38% of regions with differential nucleosome footprints showed no significant change in ATAC accessibility. These changes would have been entirely missed by conventional differential accessibility analysis. The data argue that "chromatin openness" and "proper nucleosomal organization" are not synonymous: the stage lights remain on, but the actors are no longer in position. Motif enrichment at nucleosome‑lost regions strongly implicated YY1, NRF1, and CCTF---known regulators of HSC quiescence and self‑renewal---while Ets/Runx/AP‑1 motifs were gained. Visualization of the Wasl promoter showed clear nucleosome phasing in young HSCs that nearly disappeared in aged HSCs, accompanied by loss of YY1/NRF1 and gain of aberrant Ets/Runx/AP‑1 binding.
Collectively, this points to a core mechanism: the decline of nucleosome organisers such as YY1 and NRF1 loosens nucleosomal architecture, allowing inappropriate TFs to invade---and this chain of events may underpin key aspects of haematopoietic ageing.
Outlook
This work elevates ATAC‑seq from a peak‑centric view to a high‑resolution readout of regulatory occupancy. All code and models are publicly available (https://github.com/buenrostrolab/PRINT), making the framework immediately accessible to the field. The biological findings---progressive CRE widening and age‑associated nucleosome dephasing---were previously invisible. While orthogonal ChIP‑seq validation for the de novo composite motifs and genetic dissection of causality in ageing remain as logical next steps, the toolkit itself is a powerful new lens for studying gene regulation.
PMID: 39843737 PMCID: PMC11839466 DOI: 10.1038/s41586-024-08443-4
Multiscale footprints reveal the organization of cis-regulatory elements - PubMed


